
ToeyToey.
IELTS
TOEIC
Speaking
PricingBlog
Log in
Start free
ToeyToey.

Your AI English coach for TOEIC, IELTS and Speaking — practice, instant feedback, and a plan, all in one place.

Product

  • Listening
  • Reading
  • Speaking
  • Writing
  • Grammar
  • Vocabulary
  • Practice tests

Resources

  • Blog
  • IELTS Writing Samples
  • IELTS Speaking Samples
  • IELTS Tools
  • What's new
  • Study plan
  • Pricing

About

  • About us
  • Contact
  • Feedback

Legal

  • Terms of Service
  • Privacy Policy
  • Commercial Disclosure

© 2026 Toey. All rights reserved.

IELTS is a registered trademark of the University of Cambridge, the British Council, and IDP Education Australia. This site and its owners are not affiliated, approved or endorsed by the University of Cambridge ESOL, the British Council, or IDP Education Australia.

ETS®, TOEIC® and TOEFL® are registered trademarks of Educational Testing Service (ETS). This website is not endorsed or approved by ETS.

DashboardMy planMock testsExam Mode
Home/IELTS/Writing Samples/Academic Task 1
Academic Task 1

IELTS Writing Task 1: Bar Chart (Band 9 Sample Answer)

This Academic Task 1 asks you to summarise a bar chart comparing coffee and tea habits across five Australian cities. A band-9 response paraphrases the chart, gives a clear overview of the main patterns, and then groups the key figures into two organised body paragraphs. The model below is about 175 words.

Get your own IELTS essay graded by AI

Band scores on all four criteria, line-by-line corrections and a model rewrite — free to start.

Grade my essay free

01 · The task

The chart below shows the results of a survey about people’s coffee and tea buying and drinking habits in five Australian cities. Summarise the information by selecting and reporting the main features, and make comparisons where relevant.
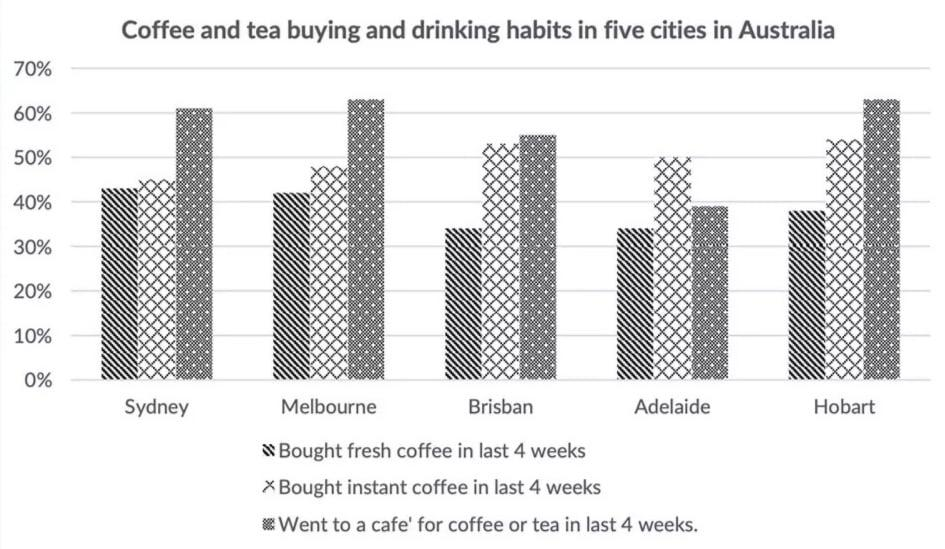
Bar chart comparing the percentage of people in Sydney, Melbourne, Brisbane, Adelaide and Hobart who bought fresh coffee, bought instant coffee, or went to a café for coffee or tea in the last four weeks.

02 · Band 9 sample answer

177 words · Band 9

The bar chart compares the percentage of residents in five Australian cities who, over a four-week period, bought fresh coffee, bought instant coffee, or visited a café for coffee or tea.

1. Overview

Overall, going to a café was the most popular activity in most of the cities, while buying fresh coffee was generally the least common. Adelaide was the clear exception, being the only city where café visits were not the leading habit.

2. Key features

Café visits were highest in Melbourne and Hobart, at 63% each, closely followed by Sydney on 61%. Adelaide stood well apart, with only 39% of people having visited a café. Buying fresh coffee varied less and remained comparatively low throughout, ranging from 34% in Brisbane and Adelaide to 43% in Sydney.

Instant coffee showed the opposite tendency. It was the leading habit in Adelaide at 50%, and was similarly high in Hobart and Brisbane, at 53% and 52% respectively, whereas it fell to 44% in Sydney and 47% in Melbourne. In these two larger cities, then, residents clearly favoured cafés over instant coffee at home.

03 · Why this scores Band 9

Task Achievement

The response selects the truly significant patterns — café visits leading in four cities, Adelaide as the exception, and instant coffee dominating there — rather than listing all fifteen values. A separate overview states the overall trend without any numbers, which band 9 requires.

Coherence & Cohesion

The four-part structure (introduction, overview, then two grouped body paragraphs) is textbook. Comparison signposts — "closely followed by", "stood well apart", "showed the opposite tendency", "whereas" — sequence the data naturally rather than mechanically.

Lexical Resource

Survey-description language is varied and precise — "the leading habit", "varied less", "comparatively low", "the opposite tendency", "clearly favoured" — with accurate approximation ("ranging from … to"). No word is misused or repeated needlessly.

Grammatical Range & Accuracy

A mix of structures supports the data cleanly: a "who … " relative clause in the introduction, comparative and superlative forms ("highest", "less", "similarly high"), and "respectively" to pair figures accurately. The report is error-free with no forced complexity.

04 · Useful collocations for this task

Tap a phrase to see what it means and how to use it. Natural collocations like these lift your Lexical Resource score.

05 · Frequently asked questions

How do I write the overview for a bar chart?

State the biggest overall patterns without specific numbers — here, that café visits led in most cities and fresh coffee was generally lowest. A clear overview is the single most important feature examiners look for above band 6.

Do I need to mention every bar?

No. Band 9 means selecting and grouping the significant features — the highs, lows and exceptions — not reporting all fifteen values. Over-listing minor data actually lowers your score.

How long should Academic Task 1 be?

At least 150 words in about 20 minutes. A band-9 answer is typically 170–200 words. This model is 177 words.

Should I compare the cities or describe them one by one?

Compare. Grouping by behaviour and highlighting contrasts ("whereas", "the exception") shows the examiner you can select and relate data, which scores far higher than a city-by-city list.

Want feedback on your own answer?

Toey grades your essay on Task, Coherence, Lexical Resource and Grammar, then shows exactly how to reach the next band — free to start.

Try the free IELTS Writing grader

More Academic Task 1 samples

  • IELTS Writing Task 1: Line Graph (Band 9 Sample Answer)
  • IELTS Writing Task 1: Table (Band 9 Sample Answer)
  • IELTS Writing Task 1: Process Diagram (Band 9 Sample)
  • IELTS Writing Task 1: Map (Band 9 Sample Answer)
  • IELTS Academic Writing Task 1: Household Appliances & Housework Line Graph (Band 9 Sample)
  • IELTS Academic Writing Task 1: Urban Population Line Graph (Band 9 Sample)
  • IELTS Academic Writing Task 1: Community Centre Activities Line Graph (Band 9 Sample)
  • IELTS Academic Writing Task 1: Industrial Area Map (Band 9 Sample)
  • IELTS Academic Writing Task 1: Library Then & Now Map (Band 9 Sample)
  • IELTS Academic Writing Task 1: US Household Income Bar Chart (Band 9 Sample)
  • IELTS Academic Writing Task 1: Plastic Bottle Recycling Process (Band 9 Sample)
  • IELTS Academic Writing Task 1: Graduate Destinations Pie Chart & Table (Band 9 Sample)
  • IELTS Academic Writing Task 1: Shop Closures & Openings Line Graph (Band 9 Sample)
  • IELTS Academic Writing Task 1: Sugar Production Process (Band 9 Sample)
  • IELTS Academic Writing Task 1: US Jobs by Sector Line Graph (Band 9 Sample)
  • IELTS Academic Writing Task 1: Instant Noodles Process (Band 9 Sample)
  • IELTS Academic Writing Task 1: Harbour Map Changes (Band 9 Sample)
  • IELTS Academic Writing Task 1: Biofuel (Ethanol) Production Process (Band 9 Sample)
  • IELTS Academic Writing Task 1: Rain-Shadow Desert Formation (Band 9 Sample)
  • IELTS Academic Writing Task 1: Café Redesign Map (Band 9 Sample)
  • IELTS Academic Writing Task 1: Nutrients by Meal Pie Charts (Band 9 Sample)
  • IELTS Academic Writing Task 1: Police Budget Table & Pie Charts (Band 9 Sample)
  • IELTS Academic Writing Task 1: Dance Classes Pie & Bar Chart (Band 9 Sample)
  • IELTS Academic Writing Task 1: Family Spending Bar Chart (Band 9 Sample)
  • IELTS Academic Writing Task 1: Metal Prices Line Graph (Band 9 Sample)
  • IELTS Academic Writing Task 1: Library Users Pie & Table (Band 9 Sample)
  • IELTS Academic Writing Task 1: Dependent Population Bar Chart (Band 9 Sample)
  • IELTS Academic Writing Task 1: School Spending Pie Charts (Band 9 Sample)
  • IELTS Academic Writing Task 1: Consumer Expenditure Table (Band 9 Sample)
  • IELTS Academic Writing Task 1: Qualifications by Gender Bar Chart (Band 9 Sample)
  • IELTS Academic Writing Task 1: Reasons for Migration Pie Charts (Band 9 Sample)
  • IELTS Academic Writing Task 1: Global Water Use Graph & Table (Band 9 Sample)
  • IELTS Academic Writing Task 1: How a Smokehouse Works Diagram (Band 9 Sample)
  • IELTS Academic Writing Task 1: Land Degradation Pie & Table (Band 9 Sample)
  • IELTS Academic Writing Task 1: Silkworm Life Cycle & Silk Production (Band 9 Sample)
  • IELTS Academic Writing Task 1: Rainwater Recycling Process (Band 9 Sample)
  • IELTS Academic Writing Task 1: Japanese vs American Office Plans (Band 9 Sample)
  • IELTS Academic Writing Task 1: School Site Map Changes (Band 9 Sample)