
IELTS Academic Writing Task 1: Nutrients by Meal Pie Charts (Band 9 Sample)
This Academic Task 1 asks you to describe three pie charts showing which meals contribute the sodium, saturated fat and added sugar in a typical American diet. A band-9 response gives an overview of the main patterns, then reports the key figures and makes comparisons rather than listing every number. Below is a model answer of roughly 190 words, followed by why it scores 9 on all four criteria.
Get your own IELTS essay graded by AI
Band scores on all four criteria, line-by-line corrections and a model rewrite — free to start.
01 · The task
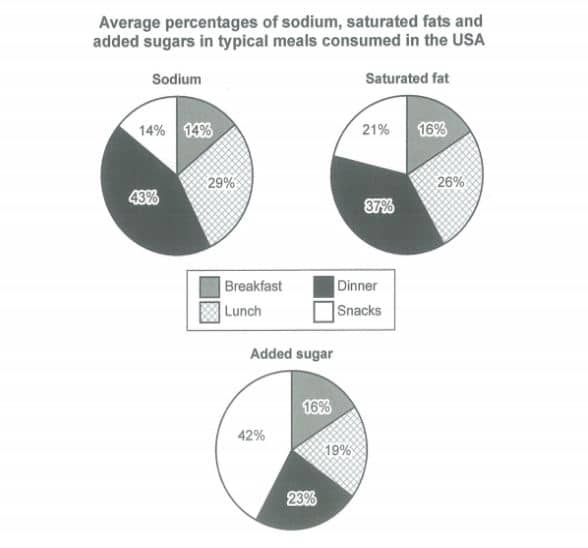
The three pie charts below show the average percentages of sodium, saturated fat and added sugar in the typical meals — breakfast, lunch, dinner and snacks — consumed in the USA. Summarise the information by selecting and reporting the main features, and make comparisons where relevant.
02 · Band 9 sample answer
190 words · Band 9The three pie charts compare the proportions of sodium, saturated fat and added sugar that Americans consume across four daily meals: breakfast, lunch, dinner and snacks.
Overall, dinner is the main source of both sodium and saturated fat, while snacks account for the largest share of added sugar. Breakfast, by contrast, contributes one of the smallest proportions of all three nutrients.
Looking first at sodium, dinner is responsible for the largest share, at 43%, followed by lunch at 29%, with breakfast and snacks supplying an equal 14% each. The pattern for saturated fat is broadly similar: dinner again tops the list at 37% and lunch provides 26%, though here snacks make up a more significant 21%.
Added sugar, however, tells a very different story. Snacks dominate, accounting for 42% of the total, well ahead of dinner at 23% and lunch at 19%. Breakfast contributes the least in this category, at just 16%, which is roughly the same modest share it provides of the other two nutrients.
03 · Why this scores Band 9
The response covers all three charts, opens with an overview that captures the key contrast (dinner drives sodium and fat, snacks drive sugar), and then reports the significant figures with comparisons rather than mechanically listing every value. It selects the main features and highlights where the added-sugar pattern breaks from the other two.
The report is logically organised — overview, then one paragraph grouping the two similar charts (sodium and fat) and one for the contrasting chart (sugar). Cohesion is smooth and varied — "Looking first at sodium...", "The pattern for saturated fat is broadly similar...", "Added sugar, however, tells a very different story" — guiding the reader through the comparison.
Data vocabulary is precise and varied — "the main source", "account for the largest share", "responsible for", "tops the list", "well ahead of", "the least" — so proportions are described in several different ways rather than repeating "the percentage of".
A range of structures presents the figures accurately: participle add-ons ("followed by lunch at 29%"), a comparative ("a more significant 21%"), and a relative clause ("which is roughly the same modest share it provides of the other two"). The percentages are reported without error.
04 · Useful collocations for this task
Tap a phrase to see what it means and how to use it. Natural collocations like these lift your Lexical Resource score.
05 · Frequently asked questions
How do I handle three pie charts without just listing numbers?
Group them in your overview by what they share and where they differ — here, sodium and fat behave alike, but sugar is dominated by snacks. Then report only the key figures with comparisons. Selecting main features, not listing every value, is what band 9 rewards.
Which figures should I include?
The highest and lowest in each chart, and any striking contrast between charts — such as snacks providing only 14% of sodium but 42% of added sugar. You do not need every single number.
What tense should I use?
The present simple, because the data describes a general situation rather than a change over time ("dinner is responsible for 43%", "snacks account for 42%"). Keep it consistent throughout.
How long should a Task 1 answer be?
At least 150 words; a band-9 answer is usually 170–200. This model is 190 words, enough for an overview and the key comparisons across all three charts. Spend about 20 minutes on Task 1.
Want feedback on your own answer?
Toey grades your essay on Task, Coherence, Lexical Resource and Grammar, then shows exactly how to reach the next band — free to start.
Try the free IELTS Writing grader