
IELTS Academic Writing Task 1: Biofuel (Ethanol) Production Process (Band 9 Sample)
This Academic Task 1 asks you to describe a diagram showing how the biofuel ethanol is produced. A band-9 response makes clear in the overview that this is a cycle rather than a straight line, then reports the stages in order using the passive voice and sequencing language. Below is a model answer of roughly 190 words, followed by why it scores 9 on all four criteria.
Get your own IELTS essay graded by AI
Band scores on all four criteria, line-by-line corrections and a model rewrite — free to start.
01 · The task
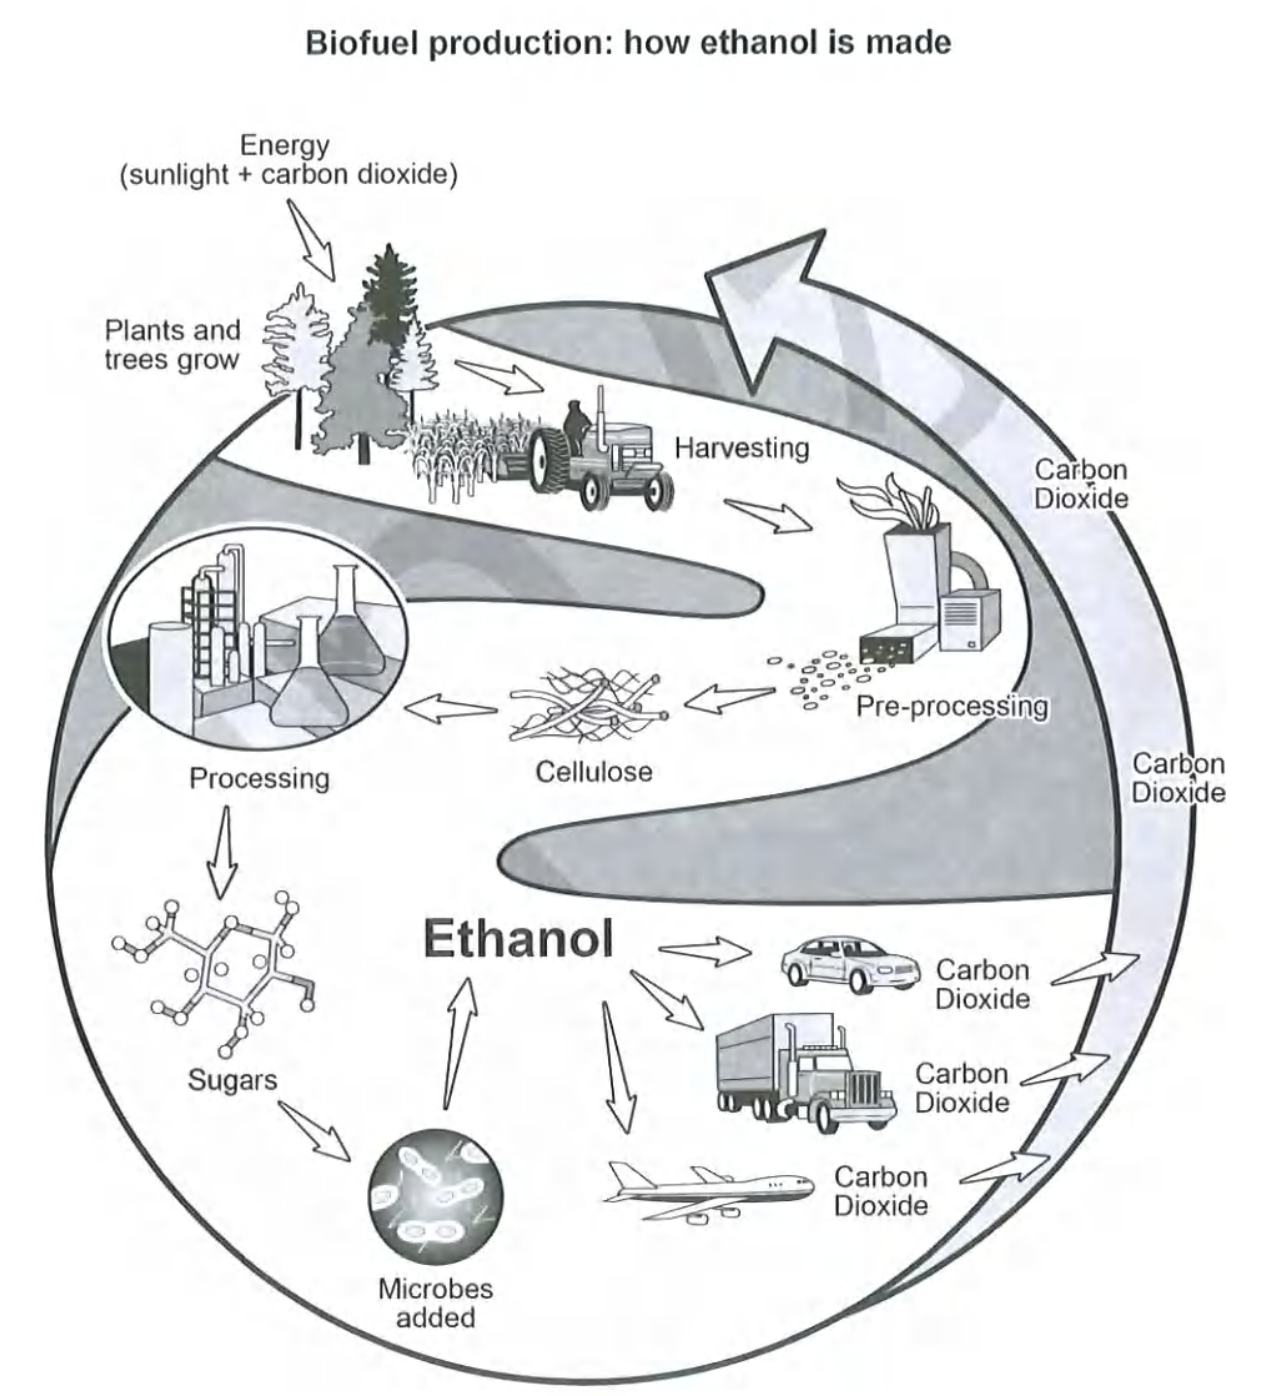
The diagram below shows how the biofuel ethanol is produced from plants and how it is used. Summarise the information by selecting and reporting the main features, and make comparisons where relevant.
02 · Band 9 sample answer
191 words · Band 9The diagram illustrates the various stages involved in producing the biofuel ethanol from plants and in using it as fuel.
Overall, the process is cyclical rather than linear, forming a closed carbon cycle: the carbon dioxide released when the fuel is burned is reabsorbed by the plants from which the next batch of fuel is made. It can broadly be divided into a growing phase, a production phase and a consumption phase.
To begin with, plants and trees grow using energy from sunlight and carbon dioxide drawn from the atmosphere. Once mature, they are harvested and then pre-processed, a step in which the raw material is broken down, so that the cellulose it contains can be extracted.
In the production phase, this cellulose is processed to release sugars, and microbes are then added to convert those sugars into ethanol. Finally, the ethanol is used to power cars, trucks and aircraft. As these vehicles burn the fuel, they emit carbon dioxide, which is subsequently taken up by growing plants, and the entire cycle begins again.
03 · Why this scores Band 9
The response covers the whole process and, crucially, its overview identifies that this is a cycle — a closed carbon loop — rather than a linear sequence, which is the single most important feature of this diagram. It then reports every key stage in order, from plant growth to combustion and reabsorption.
The report follows the ideal process shape — introduction, overview, then the stages in sequence — and groups them into growing, production and consumption phases. Sequencing language is varied and accurate — "To begin with", "Once mature", "In the production phase", "then", "Finally", "subsequently" — ending by signalling that "the entire cycle begins again".
Process vocabulary is precise and varied — "drawn from the atmosphere", "harvested", "broken down", "cellulose... extracted", "convert those sugars into ethanol", "emit carbon dioxide", "taken up by growing plants" — with accurate verbs rather than a single repeated word.
The present-simple passive is used correctly throughout — "they are harvested", "this cellulose is processed", "microbes are then added", "the ethanol is used" — exactly as a process description requires. A "so that" purpose clause and a non-defining relative clause ("carbon dioxide, which is subsequently taken up by growing plants") add range, and the writing is error-free.
04 · Useful collocations for this task
Tap a phrase to see what it means and how to use it. Natural collocations like these lift your Lexical Resource score.
05 · Frequently asked questions
How do I describe a cyclical process differently from a linear one?
State in the overview that it is a cycle, not a straight line, and end your report by noting that the process "begins again" or "repeats". This model highlights the closed carbon loop, which is exactly what a cyclical diagram rewards.
What tense and voice should I use?
Use the present simple passive throughout ("the plants are harvested", "the ethanol is used"), because the focus is on what happens at each stage, not who does it. This is the key grammatical feature of a process answer.
Do I need an overview for a process?
Yes — always. For a process, the overview states how many stages there are, whether it is linear or a cycle, and where it begins and ends. You cannot reach band 7+ without it.
How long should a Task 1 answer be?
At least 150 words; a band-9 answer is usually 170–200. This model is 191 words, enough to give an overview and describe all the main stages in order. Spend about 20 minutes on Task 1.
Want feedback on your own answer?
Toey grades your essay on Task, Coherence, Lexical Resource and Grammar, then shows exactly how to reach the next band — free to start.
Try the free IELTS Writing grader