
IELTS Writing Task 1: Line Graph (Band 9 Sample Answer)
This Academic Task 1 asks you to summarise a line graph showing tourist numbers on a Caribbean island from 2010 to 2017. A band-9 response opens with a paraphrased introduction, gives a clear overview of the main trends, and then reports the key figures in two organised body paragraphs. The model below is about 175 words.
Get your own IELTS essay graded by AI
Band scores on all four criteria, line-by-line corrections and a model rewrite — free to start.
01 · The task
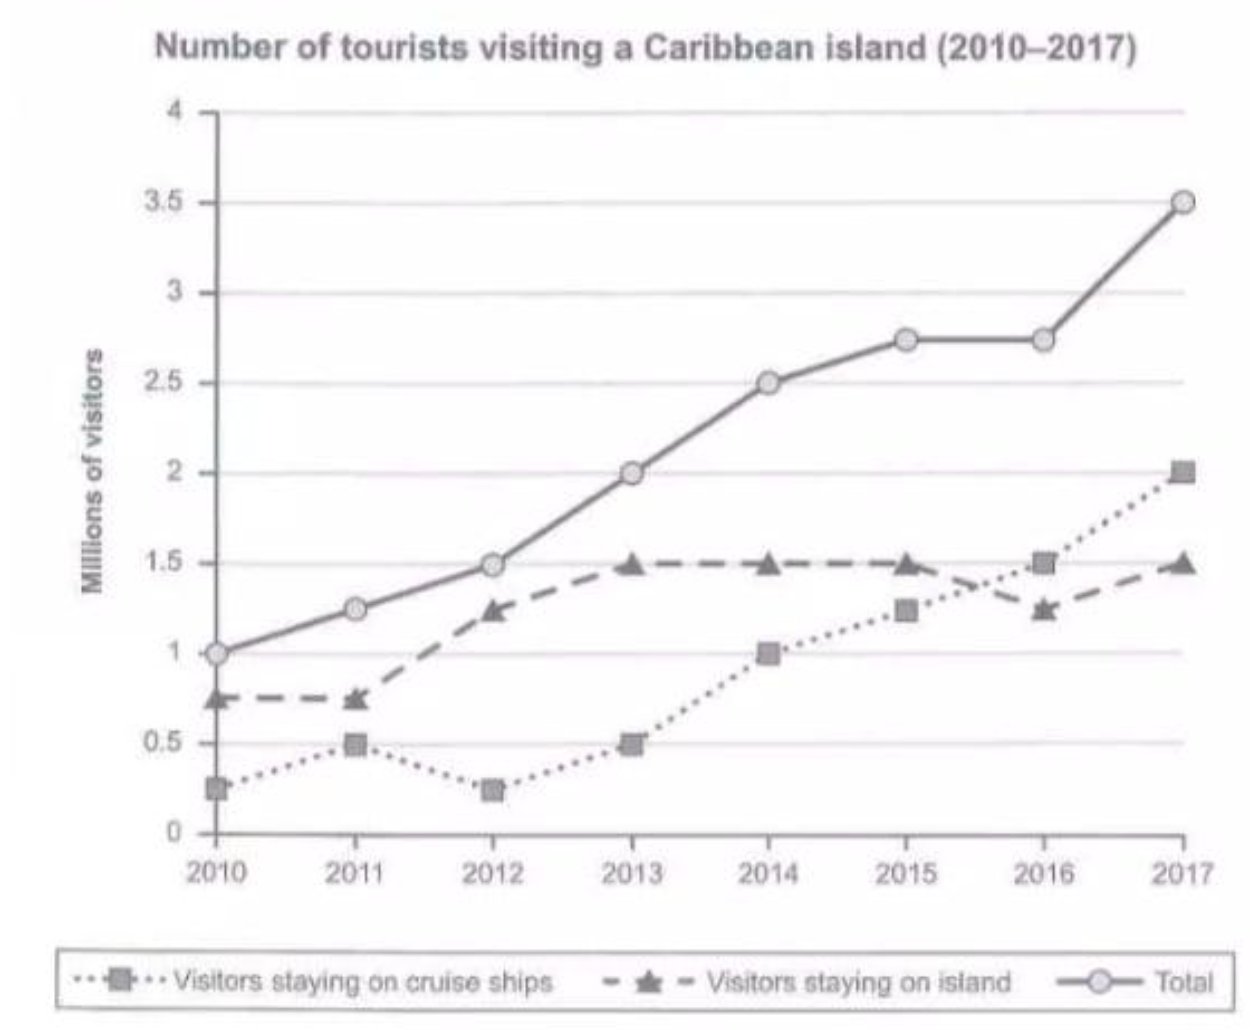
The graph below shows the number of tourists visiting a particular Caribbean island between 2010 and 2017. Summarise the information by selecting and reporting the main features, and make comparisons where relevant.
02 · Band 9 sample answer
177 words · Band 9The line graph illustrates how many tourists visited a Caribbean island each year between 2010 and 2017, distinguishing between those who stayed on the island and those who arrived on cruise ships.
1. Overview
Overall, the total number of tourists rose substantially across the period. While both categories of visitor increased, the number arriving by cruise ship grew far more dramatically and had become the larger group by the end.
2. Key features
In 2010, the island received roughly one million tourists in total, of whom around 750,000 stayed on the island and only about 250,000 arrived on cruise ships. The number staying on the island rose to approximately 1.5 million by 2013 and then held broadly steady, dipping slightly in 2016 before recovering to 1.5 million the following year.
Cruise-ship visitors followed a more volatile path: after a brief dip in 2012, their numbers climbed sharply, overtaking island-based tourists in 2016 and reaching about two million by 2017. Driven largely by this surge, the total figure more than tripled, from around one million to roughly 3.5 million over the seven years.
03 · Why this scores Band 9
The response selects and reports the genuinely important features — the overall rise, the fluctuation in island-stayers, and the dramatic growth of cruise-ship visitors — and makes the key comparison (cruise ships overtaking island stays). A separate overview paragraph states the main trend without listing every data point, which band 9 requires.
The four-part structure (introduction, overview, then two grouped body paragraphs) is textbook band 9. Time markers and comparison signposts ("and then held broadly steady", "followed a more volatile path", "Driven largely by this surge") sequence the data naturally rather than mechanically.
Trend language is varied and accurate — "rose substantially", "held broadly steady", "a more volatile path", "climbed sharply", "overtaking", "more than tripled" — with correct approximation phrasing ("roughly", "around", "approximately"). No word is misused or repeated unnecessarily.
A mix of structures supports the data cleanly: a "of whom" relative clause, past simple for completed trends, and comparative forms ("far more dramatically", "the larger group"). The report is accurate throughout with no forced complexity.
04 · Useful collocations for this task
Tap a phrase to see what it means and how to use it. Natural collocations like these lift your Lexical Resource score.
05 · Frequently asked questions
Should I include an overview in Academic Task 1?
Yes — it is essential for band 7 and above. A separate sentence or short paragraph stating the main trends (without specific numbers) is the single most important feature the examiner looks for under Task Achievement.
Do I need to describe every number on the graph?
No. Band 9 means selecting the significant features — starting and ending points, the biggest changes, and key crossovers — not listing every value. Over-reporting minor data lowers your score.
How long should Academic Task 1 be?
At least 150 words, and you should spend about 20 minutes on it. A band-9 answer is typically 170–200 words. This model is 177 words.
Can I use approximate figures like "roughly" and "around"?
Yes, and you should when reading values off a graph. Accurate approximation ("approximately 1.5 million") is better than a falsely precise number and demonstrates good lexical control.
Want feedback on your own answer?
Toey grades your essay on Task, Coherence, Lexical Resource and Grammar, then shows exactly how to reach the next band — free to start.
Try the free IELTS Writing grader